Ecommerce analytics helps you grow an online store by showing what’s working, where revenue leaks happen, and why customers drop off. When your tracking is wrong (or incomplete), you end up optimising the wrong things.
This guide walks you through a practical, setup-first GA4 approach: accurate revenue measurement, clean event tracking, funnel diagnosis, and shopping-behaviour insights you can actually use to improve conversions.
“If your tracking isn’t aligned with your ecommerce website development UAE, you risk optimising the wrong elements.”
Want cleaner revenue tracking and clearer funnels in GA4? Message Lucidly on WhatsApp for a quick GA4 measurement audit and reporting checklist.
What should I track in ecommerce analytics?
Think in layers. A clean measurement system answers four questions:
Did we make money? (revenue tracking).
Did users convert? (conversion tracking).
Where did they drop off? (funnels).
What did they do before buying? (shopping behaviour analytics).
Here’s the minimum set worth tracking on day one:
Revenue (the truth layer)
Start with revenue, because every optimisation decision should tie back to money. If your revenue numbers are wrong, every report that follows will mislead you.
Total revenue (and ideally net revenue if your setup supports it).
Refunds and returns (to spot “growth that isn’t real”).
AOV (Average Order Value).
Revenue by channel/source/landing page.
Conversions (the decision layer)
Next, track the actions that move users closer to revenue. Purchases are the headline, but micro-steps tell you why conversion changes before revenue reacts.
Purchases (primary conversion)
Add to cart, begin checkout (micro-conversions that predict purchases)
Lead conversions too, if you run quote forms / WhatsApp / call tracking
Behaviour (the “why” layer)
Finally, measure behaviour to explain patterns—especially when revenue or conversion rate shifts.
Behaviour signals reveal whether the issue is product interest, checkout friction, or device-specific UX.
Product views → add-to-cart rate.
Checkout step drop-offs (shipping, payment, review).
Device differences (mobile vs desktop).
Returning vs new buyer patterns.
This is the foundation of ecommerce analytics: reliable revenue + reliable conversion signals + behaviour context.
For a more detailed guide on ecommerce SEO structure and technical setup, you can refer to our article Ecommerce SEO for UAE Stores.
GA4 ecommerce setup: revenue tracking + event tracking (without complexity)
If you’re serious about ecommerce analytics, don’t start with dashboards. Start with data accuracy.
Step 1: Confirm you’re using GA4 ecommerce (not “pageviews-only”)
In GA4, ecommerce performance depends on GA4 ecommerce events—events that describe products, carts, checkouts, and purchases.
If your setup only tracks page views, your reporting will look “busy” but won’t explain revenue outcomes.
Step 2: Track ecommerce conversions with the right events
At minimum, your event tracking should include:
view_item (product view).
add_to_cart.
begin_checkout.
purchase.
Depending on your store and platform, you may also include:
add_shipping_info.
add_payment_info.
refund.
These are the backbone of track ecommerce conversions properly. Without them, funnel analysis and attribution become guesswork.
Step 3: Revenue tracking must be consistent and deduplicated
Most “my GA4 revenue doesn’t match Shopify/Woo/ERP” problems come from one of these:
Duplicate purchase events (especially after a payment redirect or thank-you reload).
Currency mismatches (store currency vs GA4 currency reporting).
Missing product/item details (items array not sent correctly).
Discount/shipping/tax handled inconsistently across platforms.
Practical rule: Before you publish any “insights,” validate your revenue tracking with test orders and a short live window (e.g., a day of real orders), then check for duplicates.
Step 4: Make conversion tracking explicit in GA4
In GA4, mark the right event(s) as conversions—usually purchase, and sometimes begin_checkout for diagnostic purposes (not as a business KPI). This makes conversion tracking cleaner across reports.
If you do only one thing this week: get your purchase event accurate. That’s the fastest win for ecommerce analytics.
For a measurement-first GA4 setup and cleaner ecommerce reporting, explore Lucidly’s Ecommerce Solutions in the UAE to improve revenue tracking, event tracking, and funnel visibility across your store.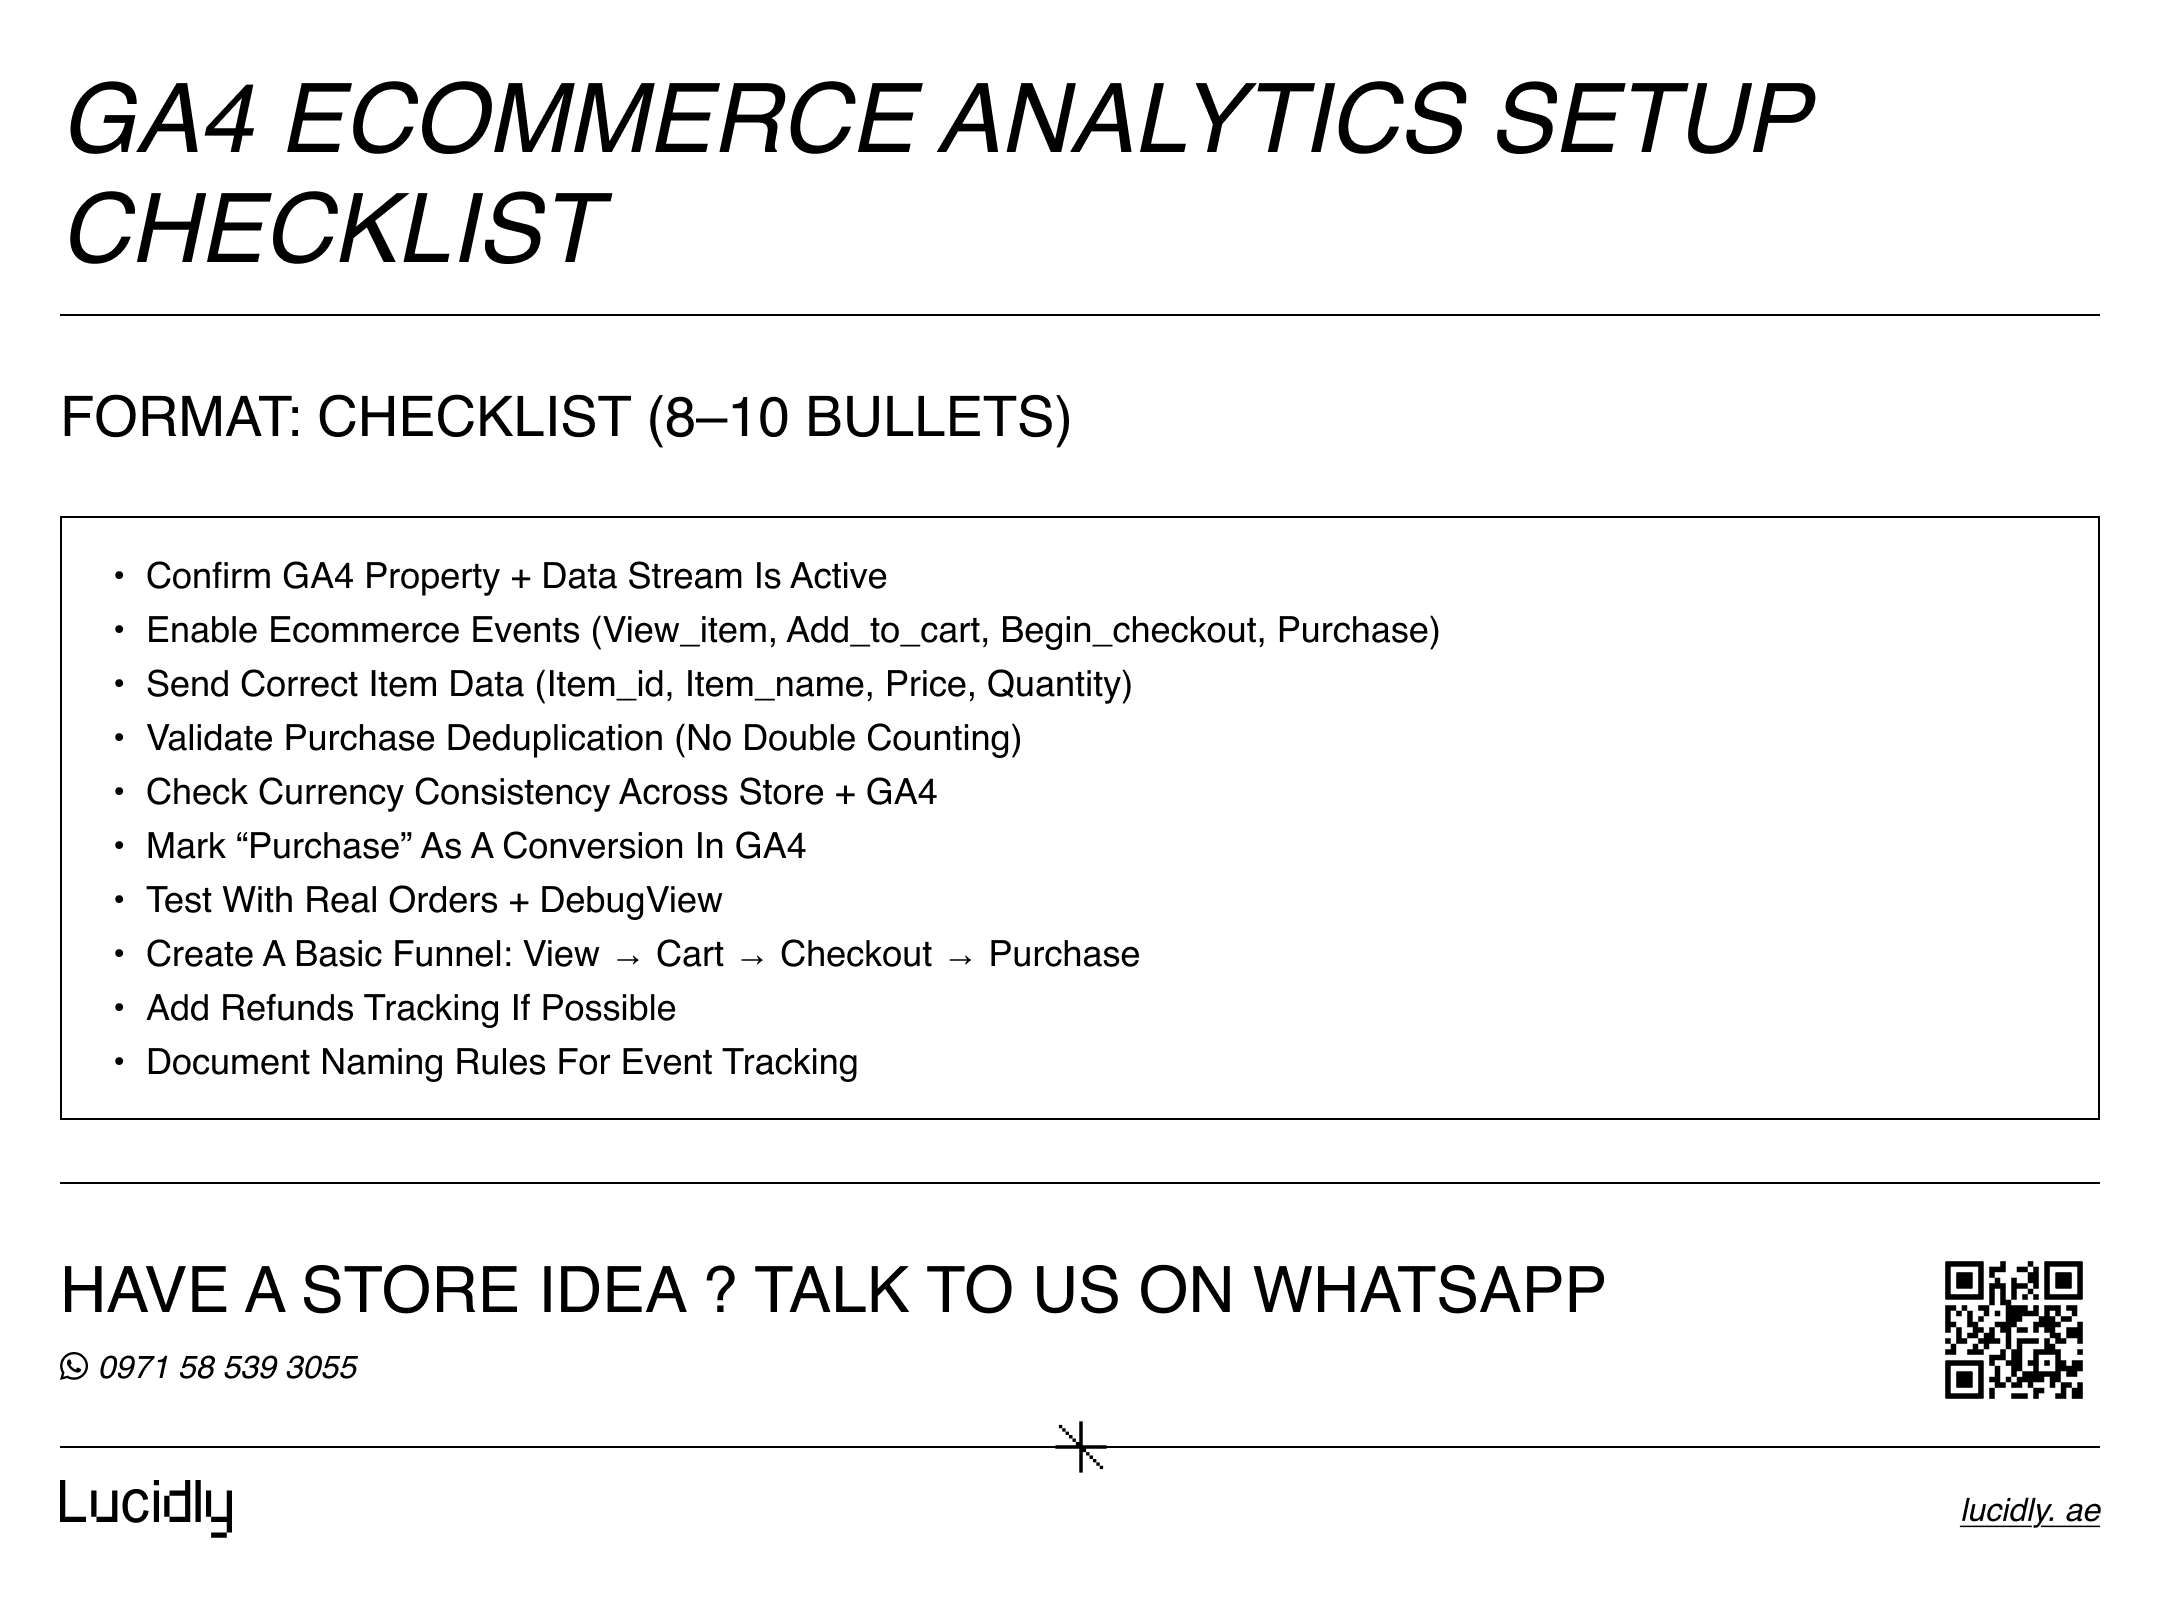
Funnels in GA4: find where money leaks (and fix the right step)
Funnels are where ecommerce analytics stops being “reporting” and becomes “decision-making.”
The minimal funnel (start here)
Use a simple funnel that mirrors a real shopping path:
view_item.
add_to_cart.
begin_checkout.
purchase.
This instantly tells you if you have a product problem (low add-to-cart), a checkout problem (checkout drop-off), or a trust/payment problem (final step drop-off).
The diagnostic funnel (when you need answers)
If you can capture checkout steps, add:
add_shipping_info
add_payment_info
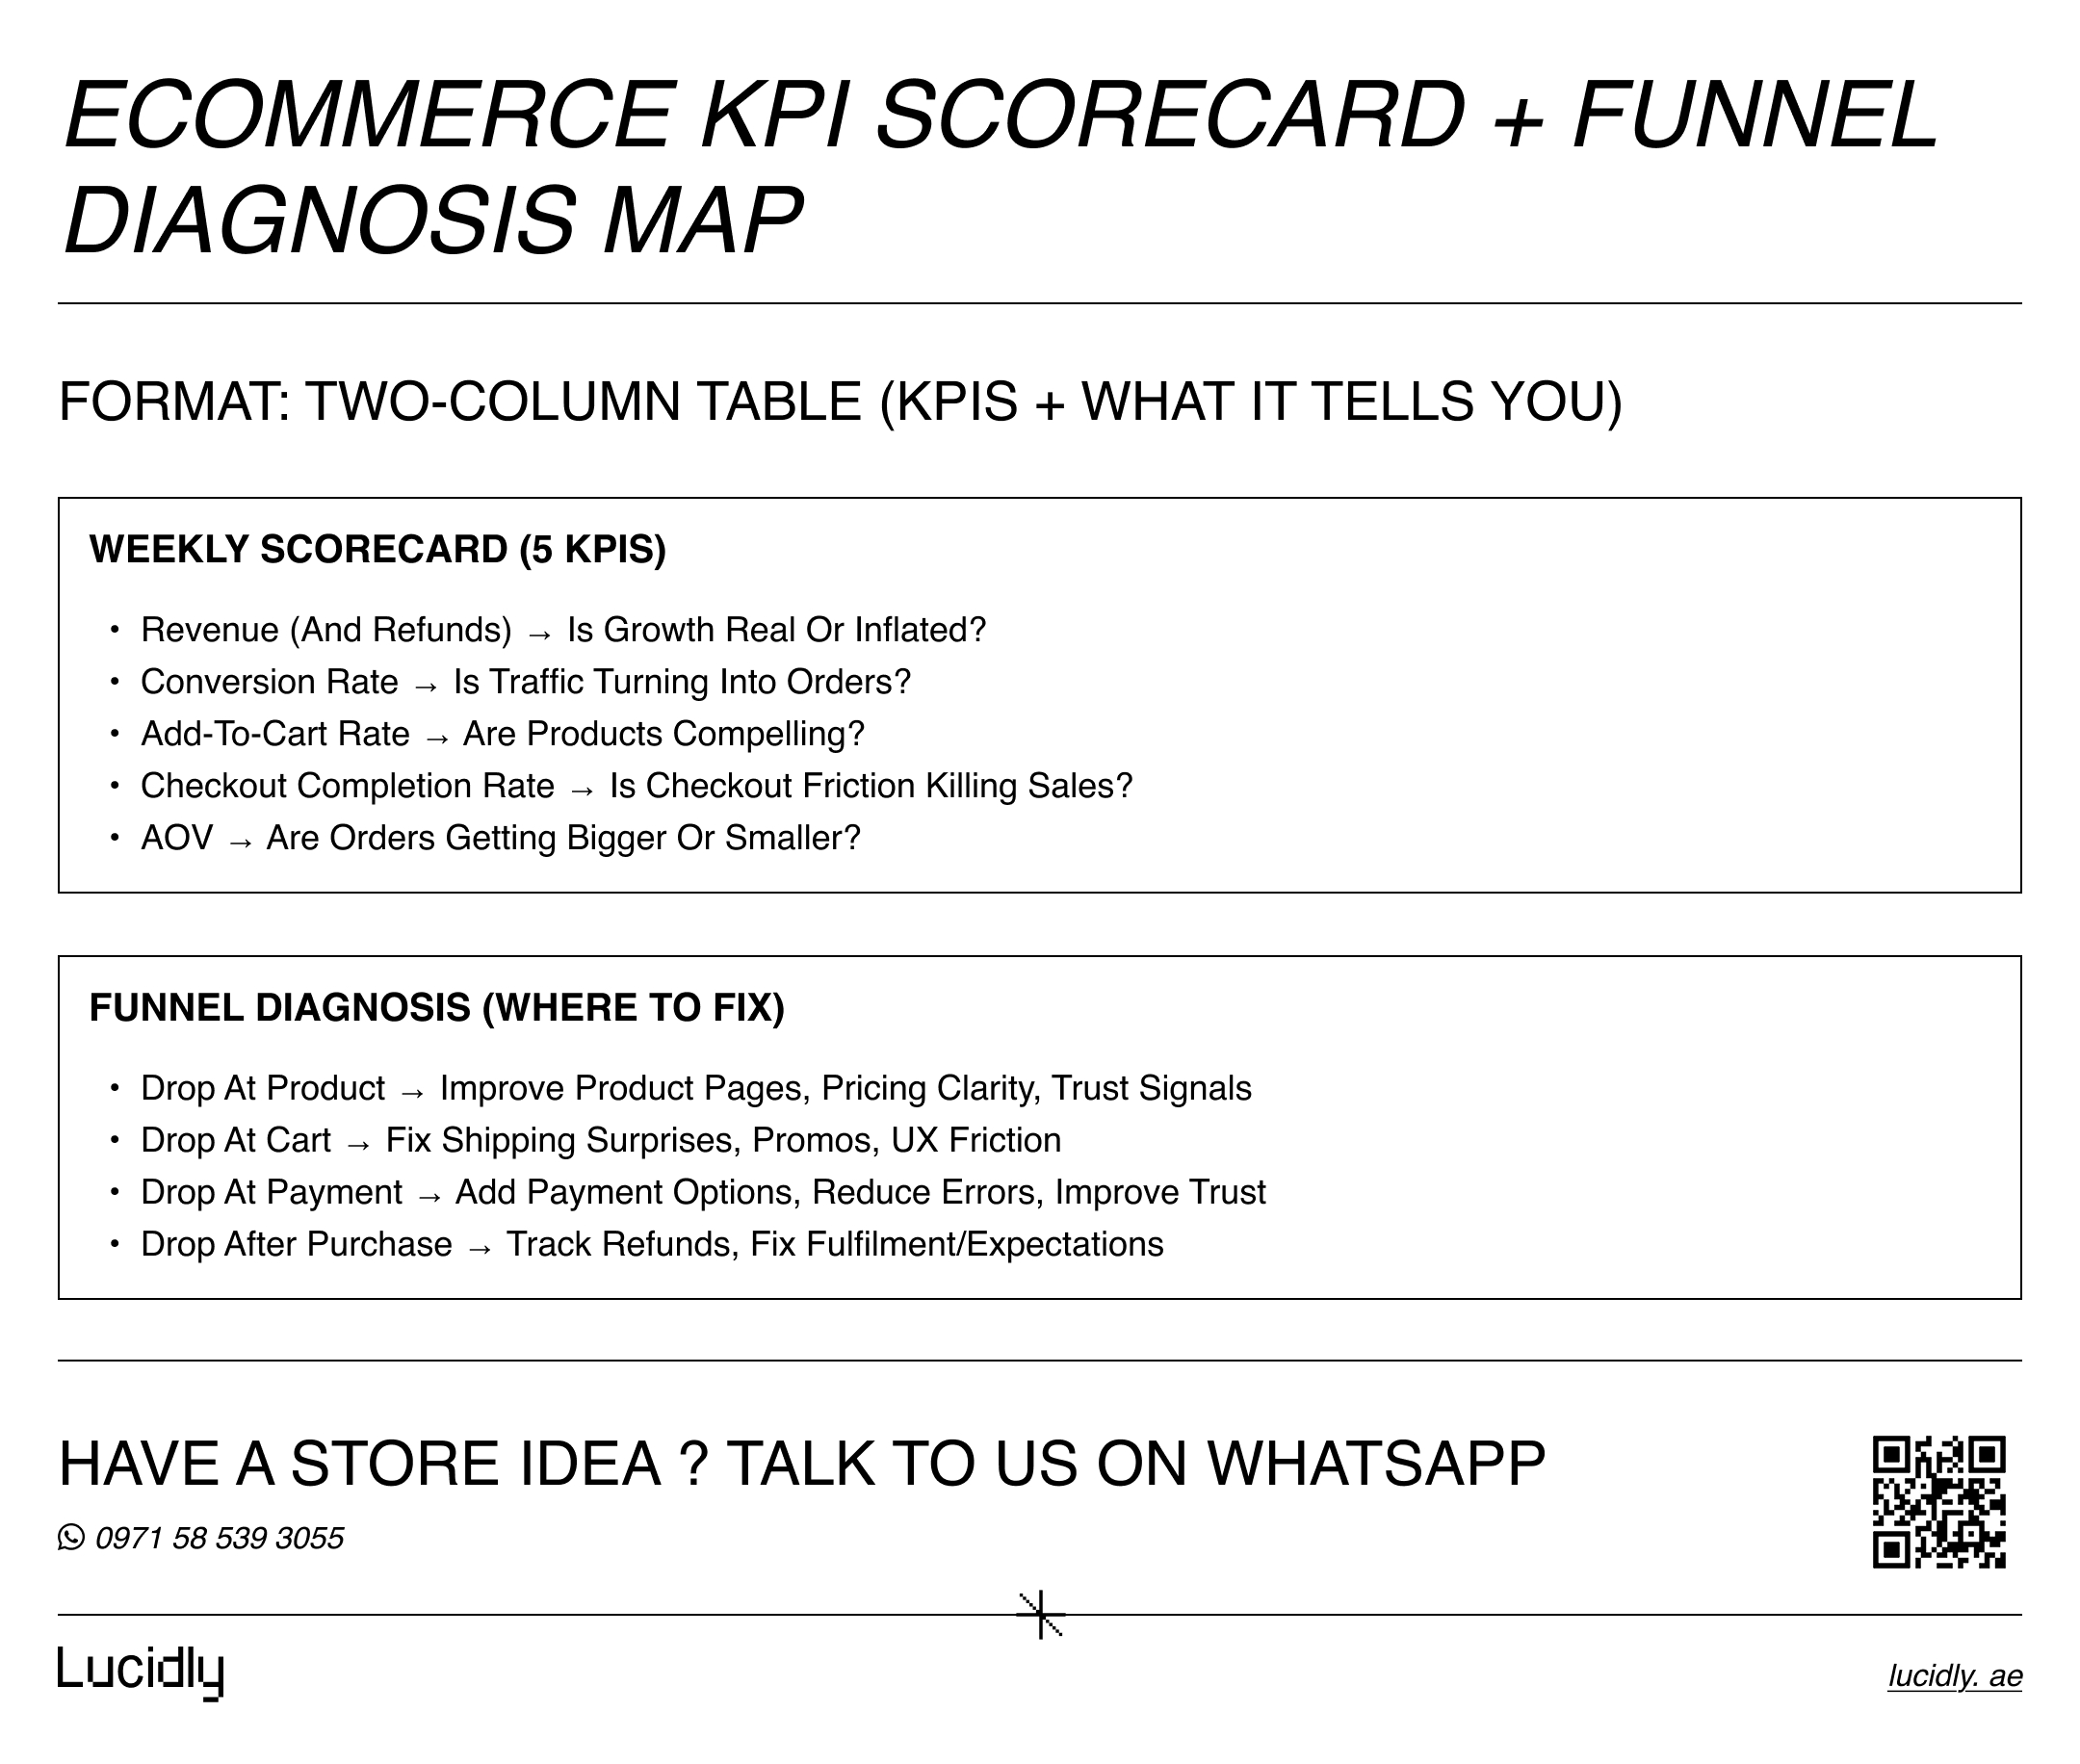
Now your funnels show exactly where the conversion friction is. Example interpretations:
Drop at shipping step → unexpected delivery cost, missing options, poor ETA clarity
Drop at payment step → limited payment methods, gateway errors, trust issues, 3DS friction
This is why shopping behaviour analytics matters: the “where” is the funnel; the “why” is behaviour plus context.
Key ecommerce KPIs: measure performance without drowning in metrics
A good KPI set is small, repeatable, and tied to decisions. The goal isn’t to track everything—it’s to track the few numbers that explain performance and tell you what to do next.
Here are the most useful ecommerce KPIs for most online stores:
Conversion KPIs
These KPIs tell you how efficiently traffic turns into action. They’re your early warning system—often they shift before revenue does, especially when checkout UX, trust, or speed changes.
Conversion rate (CR).
Add-to-cart rate.
Cart-to-checkout rate.
Checkout completion rate.
Revenue KPIs
Revenue metrics show the business outcome, not just the behaviour. Use them to validate that conversion improvements are translating into real value—and to catch issues like rising refunds or unstable AOV.
Revenue.
AOV (Average Order Value).
Revenue per user/session.
Refund rate (quality control KPI).
Customer KPIs (growth quality)
Not all growth is equal. Customer KPIs tell you whether you’re acquiring buyers who come back—or one-time shoppers who disappear after discounts. This is where sustainable growth becomes visible.
Returning customer rate.
Repeat purchase rate (if you can measure it cleanly).
LTV (Customer Lifetime Value) directionally (more below).
Use these KPIs consistently in your ecommerce reporting so your team doesn’t “change the scoreboard” every week.
And yes—ecommerce analytics is about choosing the right scoreboard, not tracking everything.
“Apply these insights to Ecommerce CRO (2026) strategies for higher conversion impact.”
Customer behaviour analytics: what people do before they buy
Traffic volume doesn’t tell you intent. Behaviour does.
What to look for in online store analytics
Start by reviewing behaviour patterns that directly influence purchase probability—especially across key pages, categories, and devices:
Which product pages create carts (not just views).
Which categories lead to checkout starts.
Which landing pages create high-quality sessions (purchase probability).
How mobile differs from desktop (especially checkout friction).
This is online store analytics used properly: not “what got clicks,” but “what created buyers.”
Cohort analysis: measure customer quality over time
Cohorts answer: Do customers who bought last month come back and buy again?
That’s how you separate “short-term spikes” from real business growth.
In cohort analysis, look at:
Repeat purchase rate by acquisition channel.
Revenue contribution over 30/60/90 days.
Product categories that drive better retention.
Cohorts are a core part of ecommerce analytics once your basic setup is clean.
LTV: keep it simple and useful
You don’t need perfect LTV math to make better decisions. Start with a directional estimate:
LTV ≈ AOV × purchase frequency × gross margin (if available)
Then compare LTV trends by:
Channel (paid search vs organic vs social).
First product purchased (some products “create repeat customers” better).
Country/device (if behaviour differs).
This is where attribution meets customer value—not just first purchase.
Ecommerce reporting: a weekly dashboard that people actually read
Most dashboards fail because they track too much, or they’re not tied to actions. Your weekly ecommerce reporting should answer:
Did revenue change?.
Did conversion rate change?.
Where did the funnel get worse/better?.
What changed in behaviour (device, landing pages, top products)?.
What action are we taking next week?.
A practical weekly scorecard (5 metrics)
Keep the weekly scorecard intentionally small. These five metrics give you a clean view of performance without noise, and they’re easy to review consistently.
Revenue (and refunds).
Conversion rate.
Add-to-cart rate.
Checkout completion rate.
AOV.
Then add one diagnostic view:
Funnel step conversion rates (view → cart → checkout → purchase).
This makes ecommerce analytics operational—not theoretical.
FAQ
What should I track in ecommerce analytics?
Track revenue (including refunds), purchase conversions, funnel steps (cart → checkout → purchase), product performance (views to carts), and customer behaviour signals like device differences and returning customer rate.
Once the basics are correct, add cohort analysis and LTV trends for customer quality.
How do I measure conversion rate?
Conversion rate is typically purchases divided by sessions (or users), depending on how you define it consistently.
Choose one definition, use it everywhere, and pair it with funnel step rates so you know whether changes come from product pages, cart, or checkout.
What are the key ecommerce KPIs?
The most useful ecommerce KPIs are conversion rate, add-to-cart rate, cart-to-checkout rate, checkout completion rate, revenue, AOV, revenue per user/session, refund rate, returning customer rate, and (directionally) LTV.
How do I track sales correctly in GA4?
Use GA4 ecommerce events (especially purchase) with correct item and currency details, avoid duplicate purchase fires (common after payment redirects or thank-you reloads), validate with test orders, and ensure conversion tracking is configured properly.
Clean revenue tracking is the foundation of accurate attribution and funnel analysis.
“Also, follow best practices from Ecommerce SEO for UAE Stores to make your pages rank while you track conversions.”
Ecommerce analytics only matters when it’s accurate and actionable. When revenue tracking, events, and funnels are set up cleanly, you stop guessing and start improving the steps that actually move profit—product discovery, cart intent, and checkout completion.
Use the KPIs and reporting rhythm in this guide to spot leaks early, validate fixes, and scale what works with confidence.
Ready to strengthen your GA4 measurement and improve funnel clarity? Message Lucidly on WhatsApp—or use the numbers on our Contact Us page to book a quick analytics audit.
References
Google Analytics Help — Recommended events (including ecommerce events like add_to_cart, begin_checkout, purchase). (Google Help)
Google for Developers — Measure ecommerce (GA4): ecommerce events, items array, currency/value parameters, and implementation guidance. (Google for Developers)
Google Analytics Help — Funnel exploration (how to build funnels and analyze drop-offs in GA4 Explorations). (Google Help)
